News & information
Economics
The worsening of economic inequality could have consequences for economic growth, according to data released by the Board of Governors of the Federal Reserve. This inequality threatens to erode the modest gains in income and growth made since the Great Recession. Much of the income gains and job growth since the recession have been in metropolitan areas, leaving much of rural America behind. The lack of income going to rural America could hinder consumer spending and limit the long-run growth potential of the economy as a whole.
Researchers found that average annual income for families in metro areas was $25,000 higher than in non-metro areas and average wealth was $500,000 higher, a gap that has doubled over the past three decades. Wealthier residents of large urban areas have accrued almost all of the new income and wealth, leaving median incomes for both rural and urban workers relatively unchanged.
The lack of income is also shown in the divergence in labor force participation between rural and urban areas. The below graph shows the labor force participation rate (LFPR) for large metro areas (blue line), small metro areas (red dotted line), and non-metropolitan areas (solid green line). Although the gaps between the three areas have existed for some time, the gap between large metropolitan and non-metropolitan labor force participation grew precipitously since 2007. From 1997 to 2007, the three areas also move together, with smaller metro areas occasionally having greater labor force participation than large metro areas.
Chart 1: Prime-age LFPR by metropolitan status
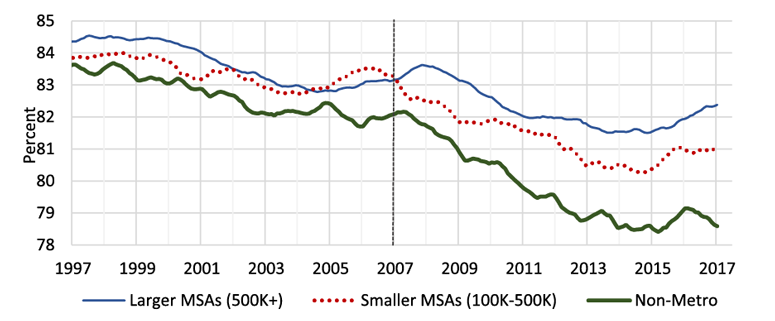
Source: Author's calculations from CPS data. Twelve-month centered moving averages. Historical CPS data reveal that the current difference in LFPR between metropolitan and non-metropolitan area participation rates is the largest in the series’ 40-year history.
This is even more striking in the case of the official unemployment rate between the three areas. While the three areas have historically moved together in terms of the unemployment rate, data since 2015 have shown a stark and widening gap between non-metro and metro unemployment.
Chart 2: Prime-age unemployment rates by metropolitan status
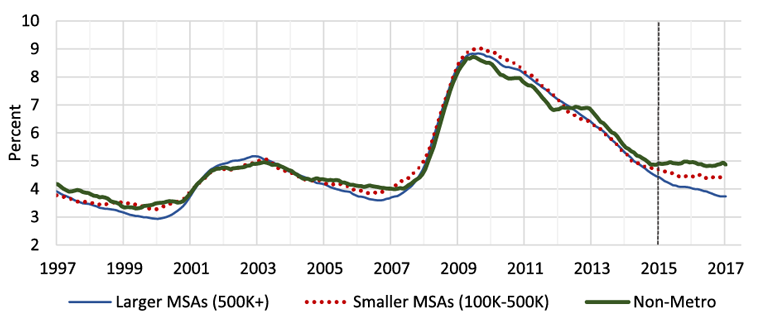
Source: Author’s calculations based on CPS data. Twelve-month centered moving averages. Gridlines denote July.