News & information
Economics
The Bureau of Labor Statistics (BLS) released the Consumer Price Index for all Urban Consumers (CPI-U) for September 2017 on Oct. 16.
Overall prices increased 0.5 percent, a 0.1 percent increase over August 2017 and a 2.2 percent increase from September 2016.
The gasoline index increased 13.1 percent over August 2017, the largest increase in gasoline prices since June 2009. It accounted for three quarters of the overall increase in prices for September 2017.
Since the energy and food indices tend to put pressure on prices overall, it is sometimes useful to exclude these variables. The index for all items less food and energy, sometimes referred to as the core CPI, rose 0.1 percent in September, a slight decrease from the August 2017 rate of 0.2 percent. The 12-month change for all items less food and energy remained at 1.7 percent for the fifth month in a row.
There are a variety of factors that lead to increases in the price of gasoline, from consumer demand to international politics, but in this case the increase is most likely due to the recent bout of hurricanes in the Gulf of Mexico area. This has led to oil refineries being damaged, disrupting the supply of gas in the market and causing the price of gas to increase.
The BLS also noted that Hurricane Irma even had a small impact on data collection for the September 2017 CPI. While an occasional hurricane or other climate-related catastrophe will have little impact on long-term economic activity, there is no question that, if these climate-related disasters become more frequent, the effects on the economy will become more pronounced.
Concerns about low inflation also have been expressed by the Federal Reserve. according to minutes from a meeting of the Federal Open Market Committee released Wednesday, in which committee members expressed concern that persistently low inflation could be caused not merely by transitory factors but also by deeper structural issues, such as the relatively low growth rate of the U.S. economy, which has averaged 2.2 percent per year since June 2009.
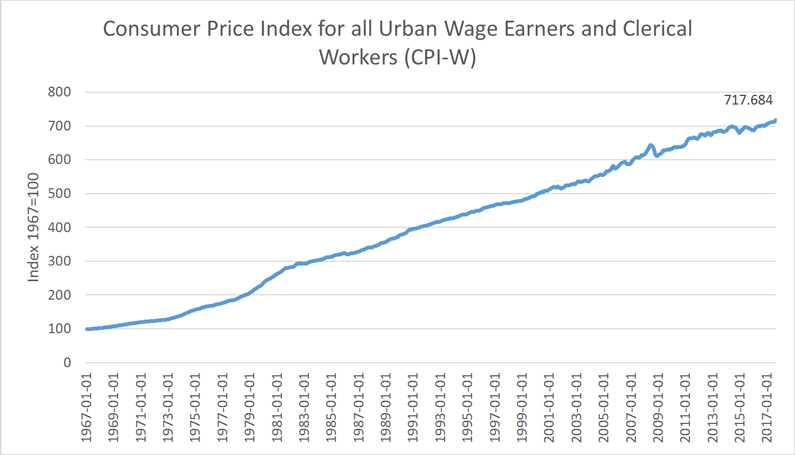
A graph of the CPI-W (Base Year 1967=100), created by NALC’s Research Department, is shown below: